Presentation
James relies on the Dropwizard metric library
for keeping track of some core metrics of James.
Such metrics are made available via JMX. You can connect for instance using VisualVM and the associated
mbean plugins.
James come with native integration to the prometheus eco-system. Read below.
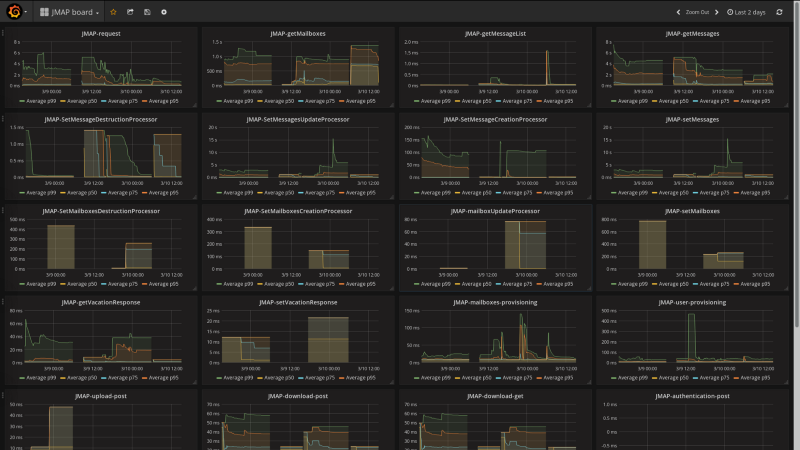
You can also export the metrics to ElasticSearch and visualize them with Grafana.
See elaticseach.properties documentation for more details on how to set this up.
WARNING: Supported ElasticSearch versions for metrics differs from the James one. Only ElasticSearch version 2 to 6 are supported. This requires a distinct ElasticSearch isntalation for metrics.
This component is furthermore unmaintained an use is discouraged.
Yet another solution is to have metrics values written in logs, see See Monitor via Logging.
Expose metrics for Prometheus collection
To enable James metrics, add extensions.routes to webadmin.properties file:
extensions.routes=org.apache.james.webadmin.dropwizard.MetricsRoutes
Connect to james-admin url to test the result:
http://james-admin-url/metrics
Available metrics
Here are the available metrics :
- James JVM metrics
- Number of active SMTP connections
- Number of SMTP commands received
- Number of active IMAP connections
- Number of IMAP commands received
- Number of active LMTP connections
- Number of LMTP commands received
- Number of per queue number of enqueued mails
- Number of sent emails
- Number of delivered emails
- Diverse Response time percentiles, counts and rates for JMAP
- Diverse Response time percentiles, counts and rates for IMAP
- Diverse Response time percentiles, counts and rates for SMTP
- Diverse Response time percentiles, counts and rates for WebAdmin
- Diverse Response time percentiles, counts and rates for each JMS message queue
- Per mailet and per matcher Response time percentiles
- Diverse Response time percentiles, counts and rates for DNS
- Cassandra Java driver metrics
- ActiveMQ broker/queue statistics
- Tika HTTP client statistics
- SpamAssassin TCP client statistics
- Mailbox listeners statistics time percentiles
- Mailbox listeners statistics requests rate
- Pre-deletion hooks execution statistics time percentiles
Retrieve available boards for Grafana.
In addition to these metrics, you can define your own metrics using the Metrics mailet. By adding
it in your mailet container, you can count emails that pass via any points. You can also, using matchers,
count emails that matches the conditions you defined.
Limitations
Those metrics are only available with Guice.
 $dateFormat.applyPattern( $format )